Automated Measurement of Corrosion Thickness & Metal Loss
Abstract
If not closely monitored, corrosion on the surface of offshore oil and gas platforms leads to the increased risk of unplanned shutdowns. On-site fabric maintenance inspections of corrosion defects are labor-intensive and require frequent travel offshore. As a result, only a sample of the total defects are monitored during each inspection campaign, and a high-risk defect could be missed completely. Through the use of laser scanning techniques, this work develops an automated approach to measuring the height of blistering corrosion or depth of surface pitting. A workflow is suggested where inspectors use a web-based implementation of this technology to conduct maintenance inspections remotely from their computers, to filter high-priority defects that should be scheduled for follow-up inspection. In doing so, on-site inspections can be more targeted and efficient. The experimental results show that the calibrated blister height measurements using the measurement method had correlations of 0.98 to 0.91 (depending on surface type) with hand-measurements done on-site by inspectors, which correspond to average root-mean-squared errors between 0.27 to 0.57 mm.
Introduction
Fabric maintenance is an integral component of operations for assuring the integrity and extending the life of resource production assets, particularly those offshore. If not thoroughly monitored, the effects of atmospheric corrosion on offshore assets can lead to costly down-time. On the surface of an asset, corrosion can appear as blistered metal or as a corrosion pit if the blister has fallen off. Beneath the surface of a blister, corrosion results in a loss of wall thickness, which heightens a component’s risk of mechanical integrity failure, and can lead to unplanned shutdowns for the production facility.
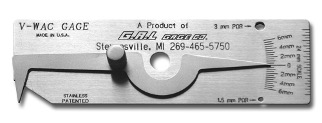
Blistering corrosion is conventionally inspected on-site by specialist engineers who must commute to the facility, which is expensive and inconvenient for offshore facilities. During non-destructive testing (NDT) campaigns, the size of corrosion defects are often individually measured using a V-WAC gauge (Figure 1). The manual measurement of each of these defects is labor-intensive, and defects can be located in hard-to-access areas of the facility.
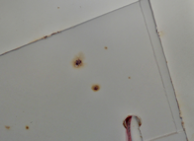
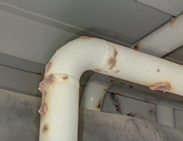
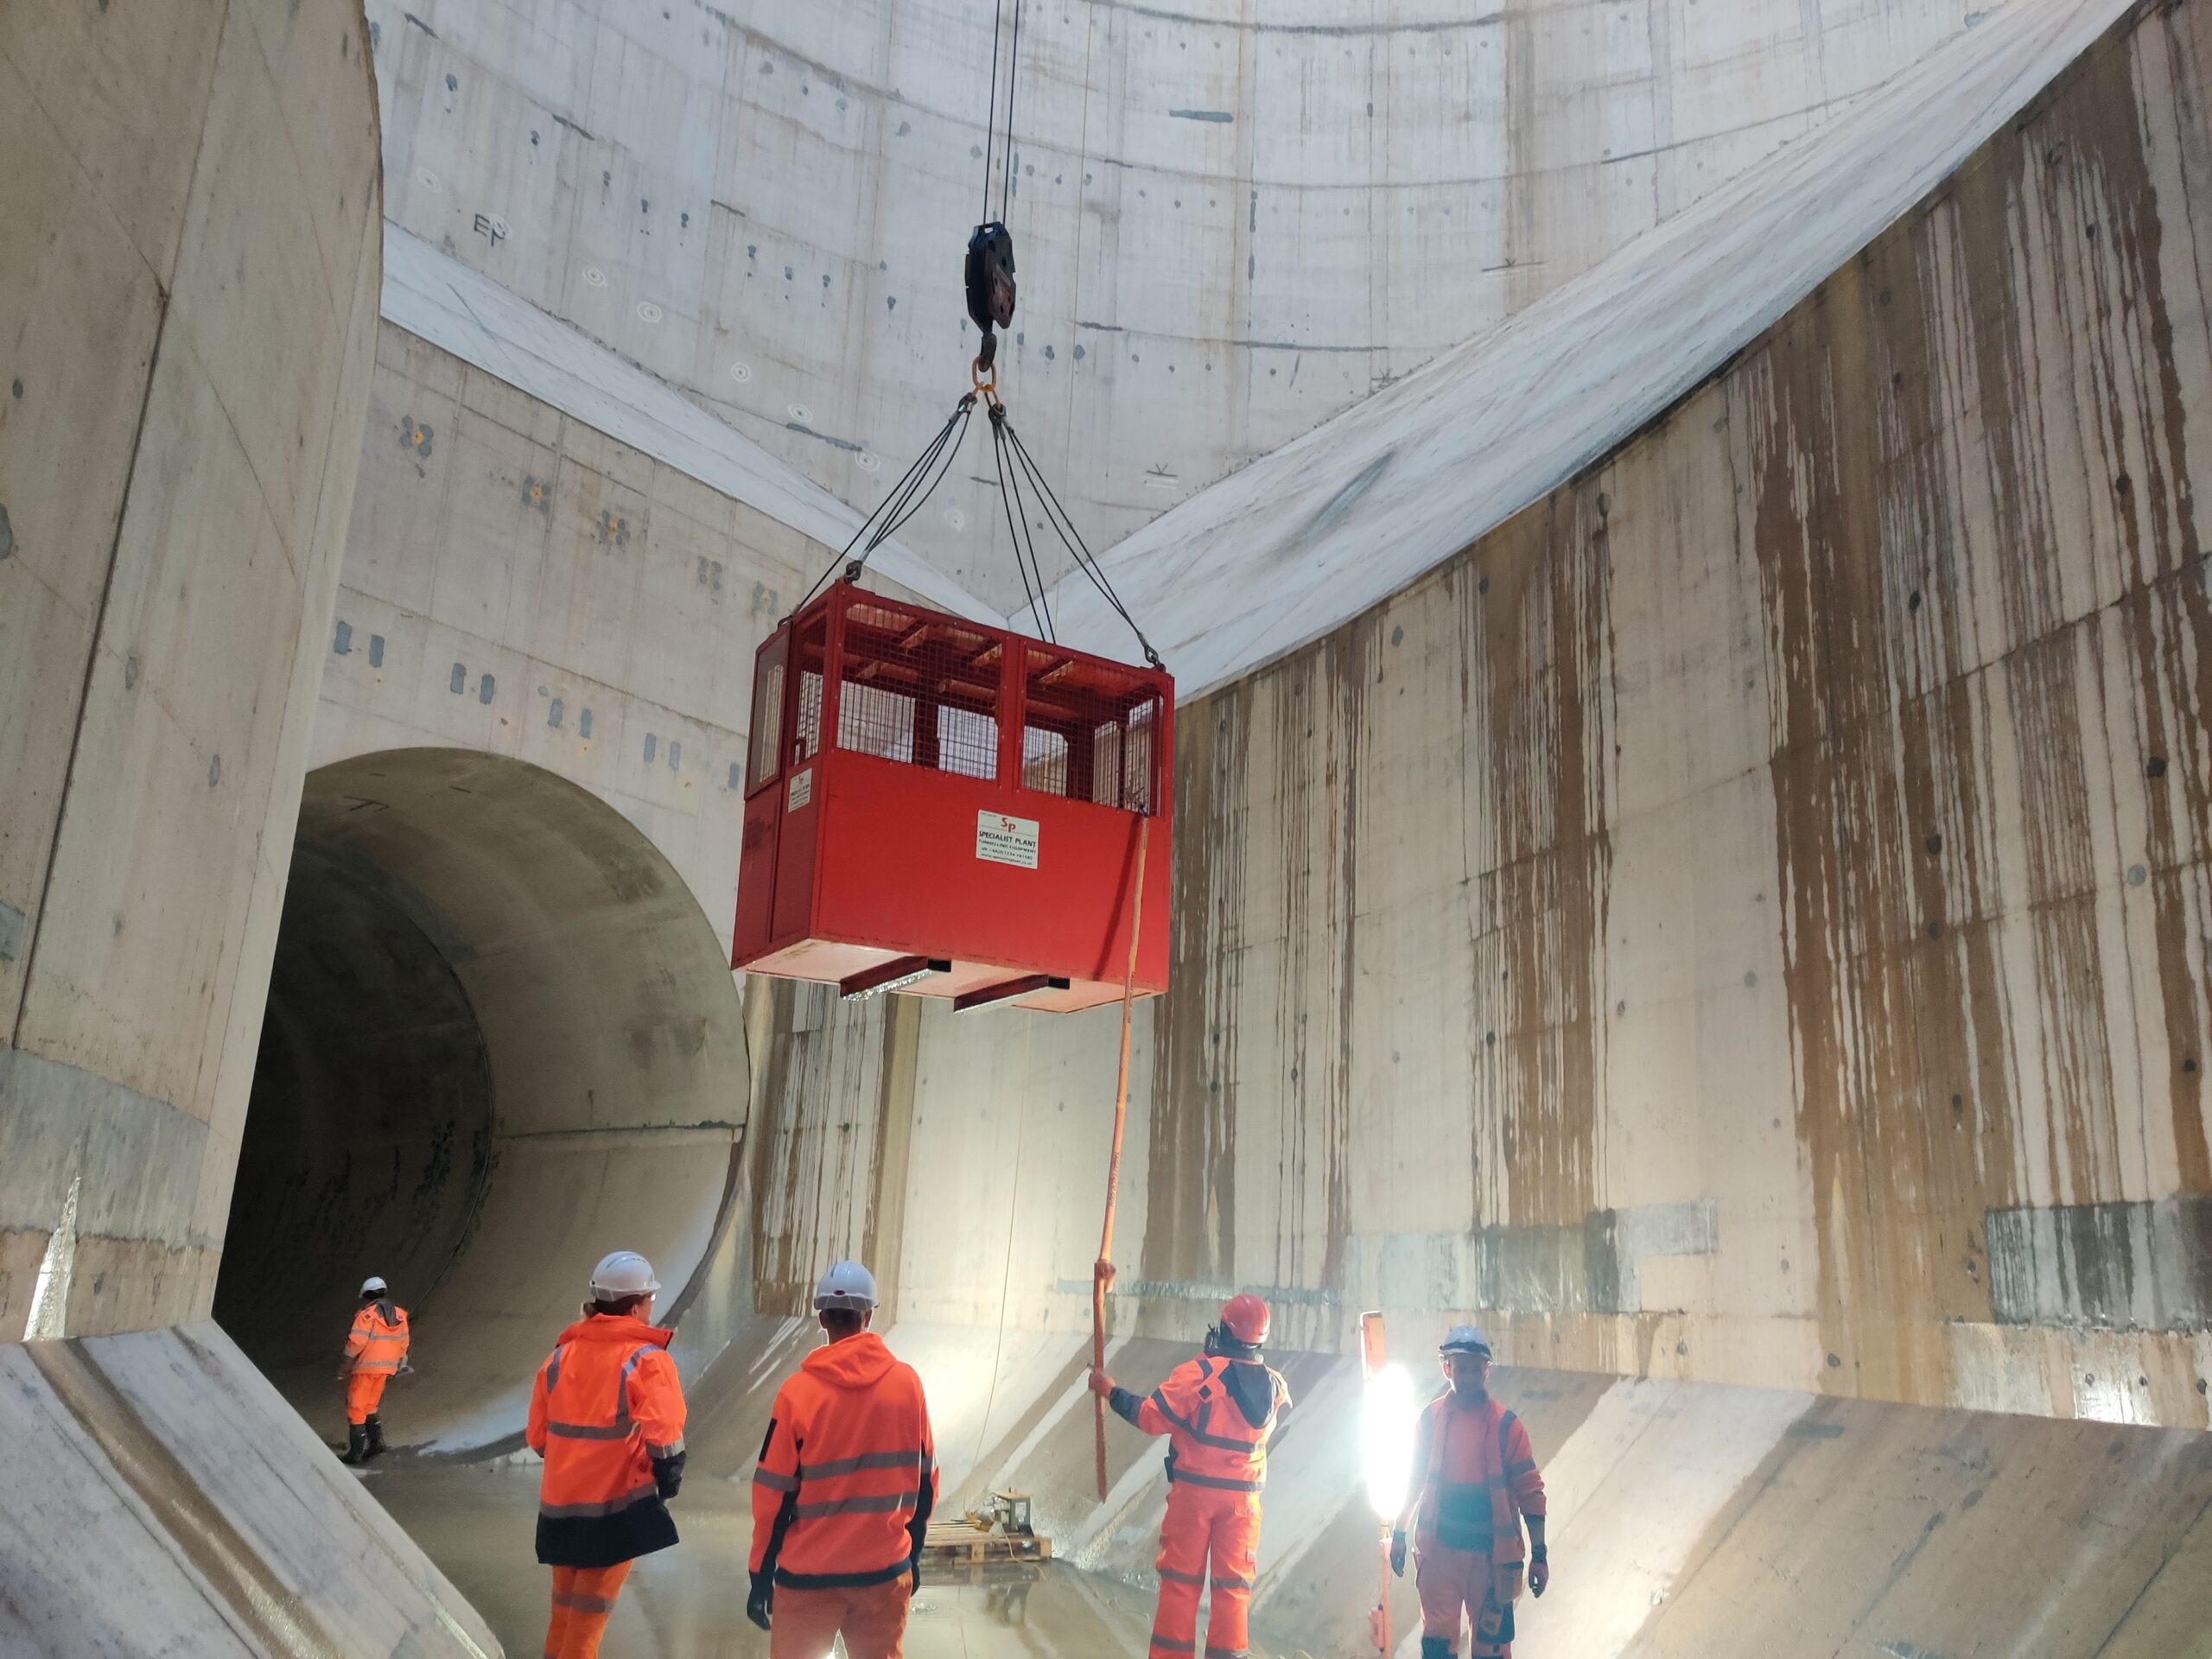
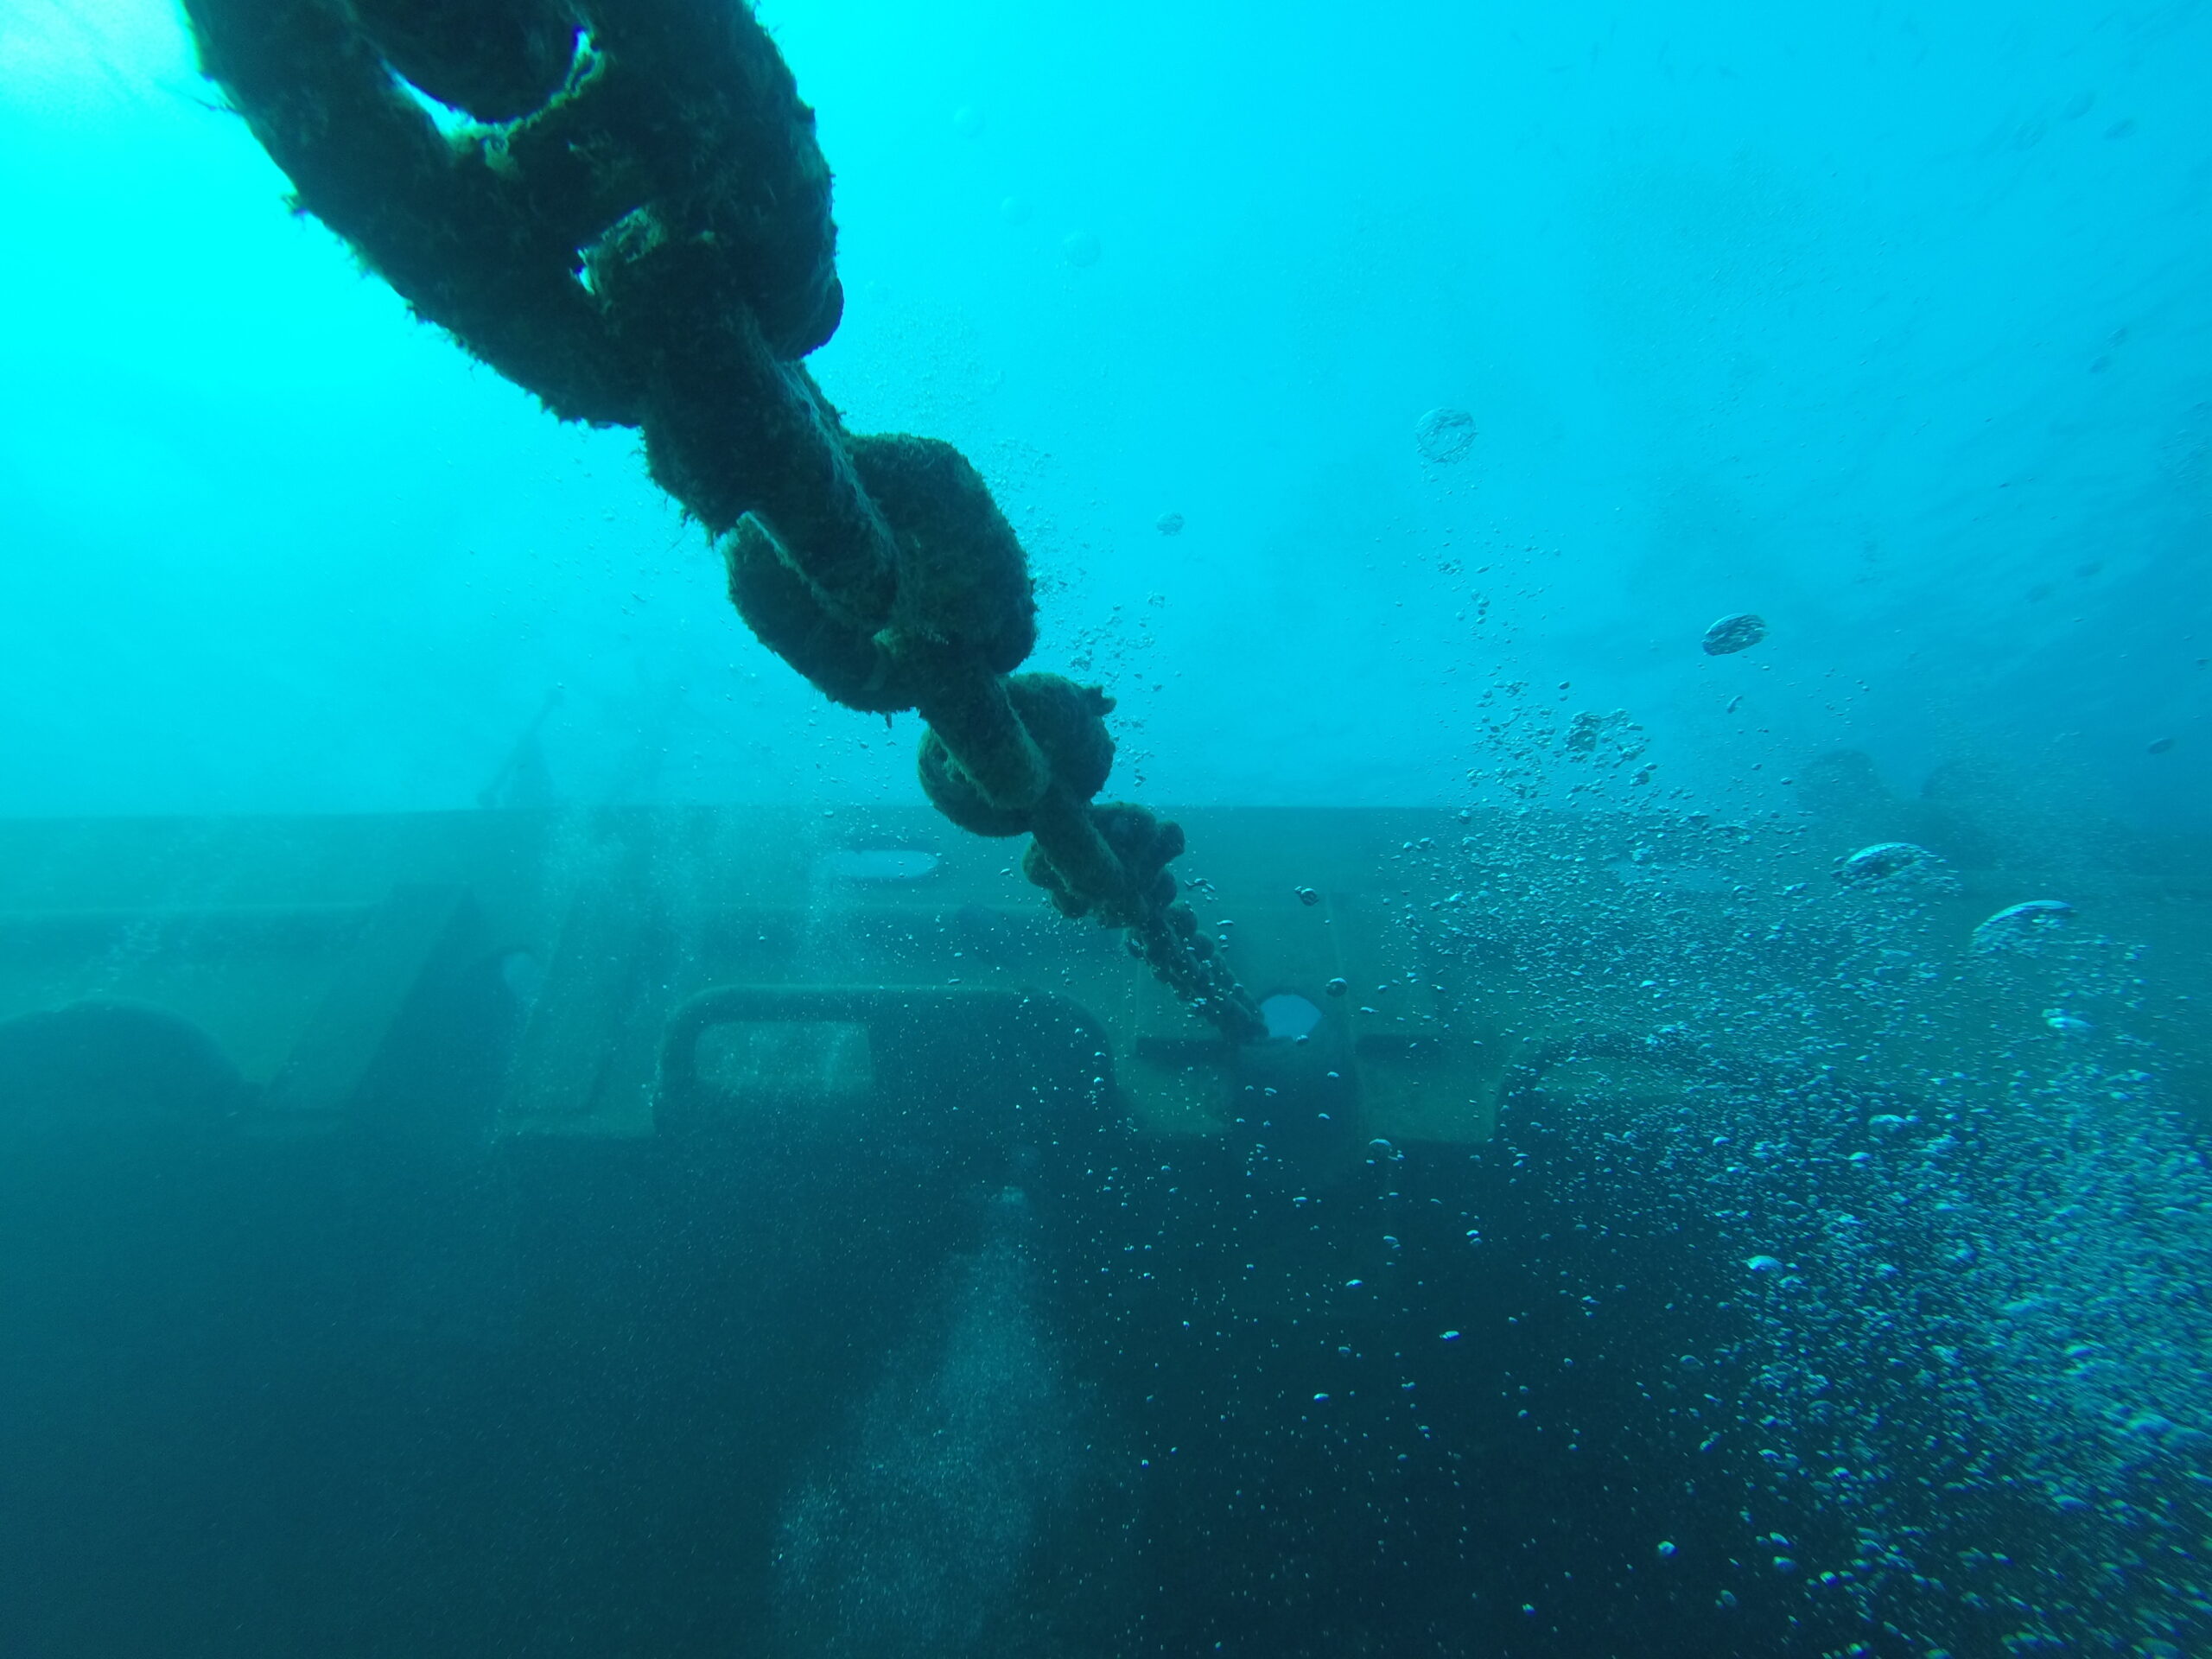
Figure 2 – Blistering corrosion on (a) the interior ceiling of an offshore facility and (b) pressure equipment at-height. These would require scaffolding or rope-access to measure their severity.
Prior work has been done into the automated detection of blisters using computer vision and machine learning (Tan et al. 2017). However, the measurement of blisters, rather than just their detection, is necessary for assessing their risk. Ferguson et al. 2021 took steps towards this by categorizing corrosion by severity; whilst this classification was sufficient for some prioritization of mechanical inspections and the scheduling of painting surveys, the severity measurement only broadly categorizes corrosion severity as light, medium, or severe.
This work develops a millimeter-accurate automated approach to measuring corrosion thickness and underlying metal loss that can be done remotely from a computer with no personnel required on-site. This process is used as an initial screen to identify potential threats that should be targeted manually by NDT processes, allowing for a more targeted inspection strategy, minimizing time spent on the offshore facility, and improved efficiency of fabric maintenance inspections. This methodology is safer, easier, faster, and allows for greater scope and coverage of inspection campaigns, reducing the chance of missing a high-risk defect.
System Overview
The workflow for using the measurement method consists of three steps. In step 1, panoramic and 3D laser scan data are captured with comprehensive coverage of the facility. Once data has been collected and processed offline, the system can be deployed. In step 2, an inspector using the deployed system remotely measures a blister from their computer, observing its shape in 3D with precise surface height measurements. Using this information, in step 3, follow-up on-site inspections and/or maintenance is scheduled using risk as priority; where risk is a function of the proportion of estimated wall thickness remaining, and thus strongly indicative of time-to-failure. Additionally, using an RBI inspection framework, the prioritization can consider the consequence of failure of the pipe, to better prioritize the work. Through the prioritization, the total number of blisters which need to be measured on-site is reduced significantly, and the probability of missing a high-risk blister is also reduced.
The following sections further breakdown the key steps in the workflow above.
Data Capture
Data capture is carried out over the entire facility with a terrestrial scanner, which provides both a 3D point cloud and panoramic images, for each data capture location. Once captured, the panoramas are registered to the laser scans such that the two data modalities are spatially aligned very accurately through the standard laser scanning registration processes.
Visualization Tool
Once the data is captured and processed, a web-based front-end interface is available for the remote inspectors to digitally walk around the facility, and measure the height of any blisters they desire. The user navigates through the facility via the panoramas, and can zoom-in on a blister they would like to measure (Figure 3a), then they select a region (Figure 3b), which prompts an inspection window to appear. The inspection window allows the user to rotate a digital surface model representation of the blister in 3D, observing it from all angles (Figure 3c). Each point on the 3D blister is colored by its surface height, as computed by the measurement method. The maximum height of the blister is displayed to the user, but they can also inspect the height of the blister at any point on its surface.
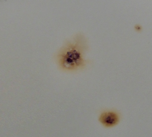
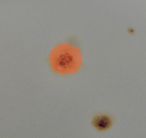
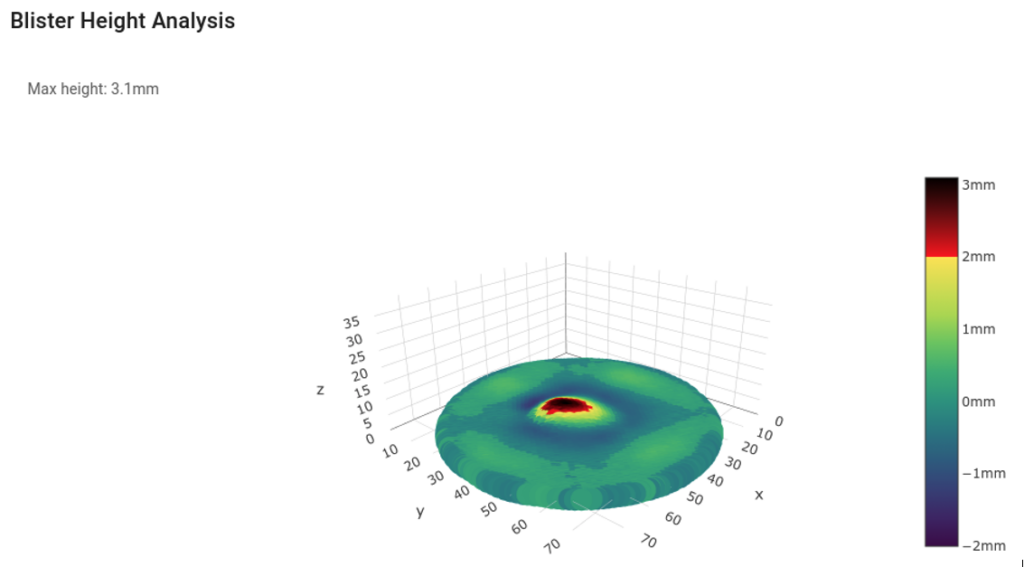
Figure 3 – Screenshots from the web interface for using the blister tool presented in this work. (a) a blister on the ceiling of a facility, viewed by the user in the panoramic image. (b) a polygon showing the region the user selected for measuring the blister height. (c) The inspection window with a 3D digital surface model of the selected blister, colored by its surface height. Black indicates the area of the blister with the greatest surface height. The maximum height computed for this blister is 3.1 mm.
Experiment
Validation Method
To determine the accuracy of the automated blister measurements, a collection of blisters on an offshore facility were measured by on-site inspectors using the tool in Figure 1. The measurements were marked next to each blister so that they could be located in the panoramic imagery. These measurements were considered ground truth maximum blister heights.
Three categories of defect were used for experiments. Firstly, a control group (Figure 4a) of surface examples which had no visible defect (i.e. the surface deformation was zero). Secondly, blistered corrosion (Figure 4b) which had a greater height than the underlying surface. Thirdly, surface-level pitting corrosion which may have been caused by a blister falling off, exposing the underlying metal loss, and potentially painted over (as in Figure 4c). These defects were marked with negative values. In total, there were twelve samples used for experiments: three from the control group, six from the blister defect group, and three from the pitting defect group.
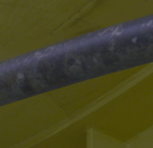
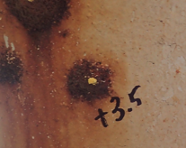
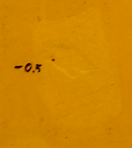
Figure 4 – Examples of samples used for experiments from the different categories of defect. (a) Control group – this sample is a smooth curved surface with no visible defect. (b) A blister defect with its on-site measurement marked next to it (in mm). (c) A pitting defect in the surface with its negative measurement marked next to it.
With the ground truth dataset collected, the proposed measurement tool was used to also measure the same blister heights or pit depths. The results were compared by fitting a linear regression model, which regressed the estimated measurements from the proposed method, to the ground truths.
Results
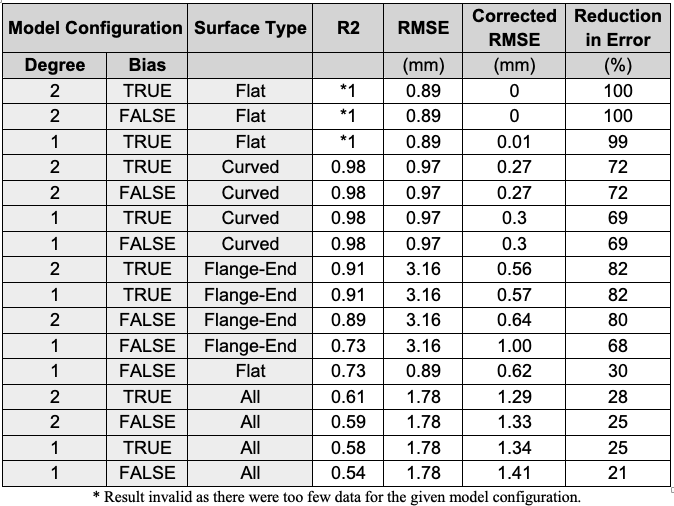
Table 1 shows some qualitative results, along with their corresponding quantitative results. For each blister, the prediction and adjusted prediction corrected by Equation (1) are both shown and compared to the hand measurement.
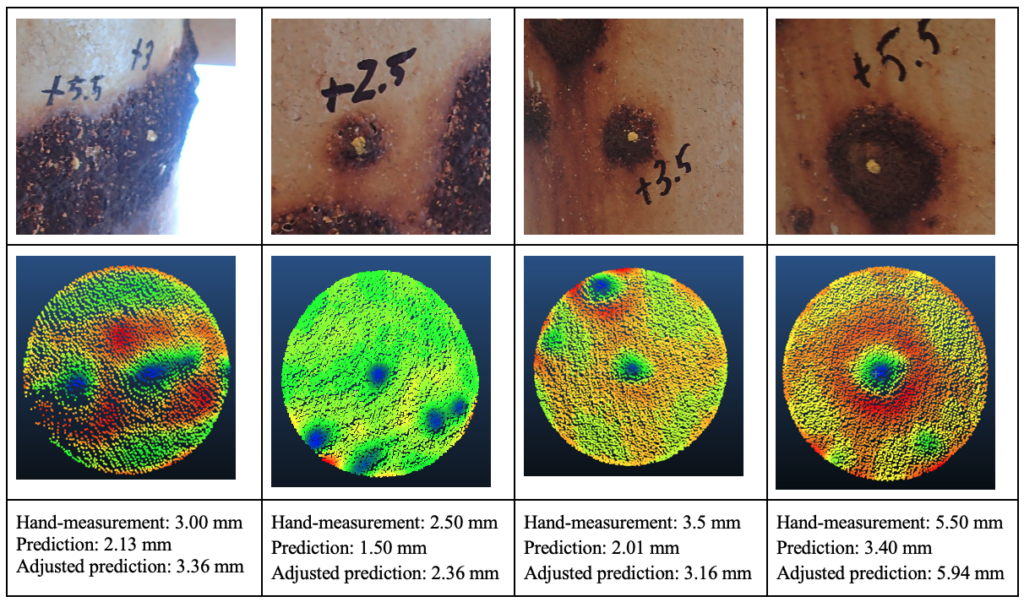
Figure 5(a) shows the pre- and post-corrected measurements for each surface-type segmentation in the dataset, as well as the combined dataset, against the ground-truth measurements. The data and model applied to the full dataset show poor fitting (R2 is 0.54 and 0.59 for the first- and second-degree models, respectively). The systematic bias mentioned in the method is evident here: due to larger blisters having more of an impact on the estimated un-deformed surface, the proposed method systematically underestimates the true blister height in a way that can be modeled and corrected.
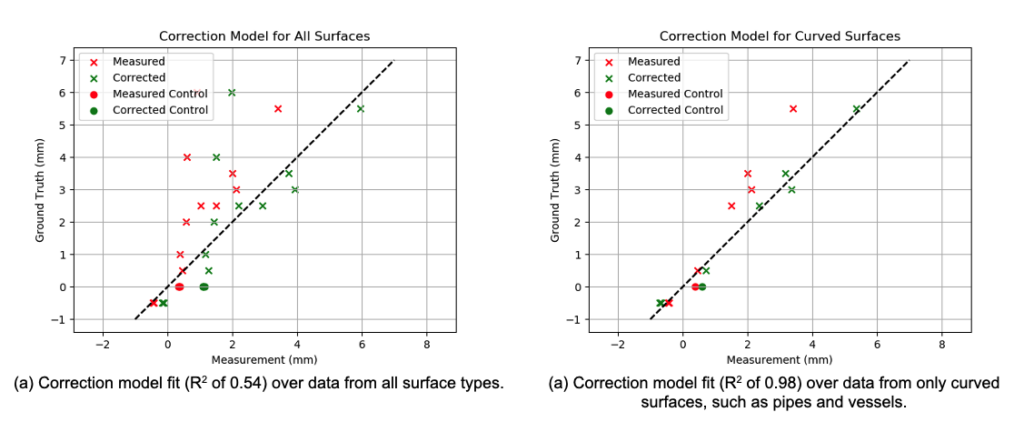
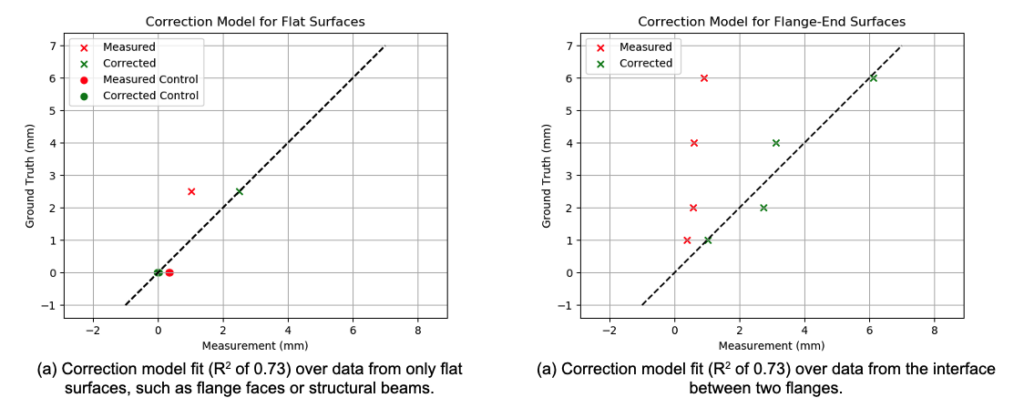
Figure 5 – Correlation between measurements using the remote automated tool and hand-measurements made on-site by inspectors. The data is categorized by surface type, and a first-degree correction model is fitted to each one.
To investigate the effect of surface type on the results, independent models were evaluated over each, and illustrated in Table 2 and Figure 5(b-d). The results show that performance is better when using the same measurement method with different correction models. Noting that the number of data points available is generally low, it was decided to use the simplest correction model possible (a first-order, linear model). Note that the control data do not to fit well for curved surfaces, which indicates that there may be mixed behaviours in the measurement method when there is no clear pit or blister. Additionally, no control data was taken for flange-end surfaces, which is noted for future work.
It is observed that the cases in which the method produces significant errors all include surfaces which have nearby sharp edges such as the edges of bolts, structural beams, pipe supports, etc. The accurate measurement of blisters and material loss on these types of surfaces remains to be investigated as future work.
Conclusion
This work presented the results of a validation study for a remote measurement method for quantifying corrosion blister height and pitting depth to within 1 millimeter. The proposed technology enables the scalable application of measuring blisters and surface pitting remotely from a computer, rather than onsite. This helps facilitate the prioritization of follow-up inspections, allowing for more targeted campaigns to be carried out offshore.
A calibration and correction model was developed for the entire dataset with poor fitness (R2 of 0.541), which motivated the error analysis which informed the decision to use separate correction models for flanges, where hard edges produced large errors and was flagged for further investigation. The corrected measurement model for each surface type works very well for curved (0.98) and reasonably for flange ends (0.91); however, there is insufficient data to discuss the perfect fit on flat surfaces. This highlights the importance of separate calibration models dependent on the geometry of the part on which the defect is to be measured.
It is prudent to continue to discover systemic errors in the measurement method, to qualify its use in wide-scale deployments in inspection/maintenance prioritization applications. We intend to continue investigating the use of this automated measurement method and explore its value to inspection and maintenance teams for both offshore and onshore facilities. A paper on the use of this technology in tandem with our prior works in computer-vision-based AI detection of corrosion is in progress, with 50-100 more data points of validation on many more types of surfaces.
References
Ferguson, E., Dunne, T., Windrim, L., Bargoti, S., Ahsan, N., Altamimi, W. 2021. Automated Painting Survey, Degree of Rusting Classification, and Mapping with Machine Learning. Presented at the Abu Dhabi International Petroleum Exhibition & Conference (ADIPEC), Abu Dhabi, 15-18 November. SPE-208119-MS. https://doi.org/10.2118/208119-MS.
Macdonald, D. D., and Engelhardt, G. R. 2010. 2.39 predictive modeling of corrosion. Shreir’s Corrosion, Elsevier BV 2: 1630-1679.
Tan, W. C., Goh, P. C., Causo, A., Chen, I., and Tan, H. K. 2017. Automated vision based detection of blistering on metal surface: For robot. Presented at the 13th IEEE Conference on Automation Science and Engineering (CASE), Xi’an, 20-23 August.