Impacts of an Automated Condition Assessment System
Summary
Objectives / Scope
Continuous Fabric Maintenance (FM) is crucial for uninterrupted operations on offshore oil and gas platforms. A primary FM goal is managing equipment degradation onset across the production facilities. General Vision Inspection (GVI) programs target timely detection and grading of defects such as corrosion severity, coating condition, and likelihood-of-failure. These processes are costly, time-consuming, labor-intensive, and must be conducted on-site. Moreover, inspection findings are subjective and provide incomplete asset coverage, leading to increased risk of unplanned shutdowns. Insights from inspection programs feed into the prioritization of equipment maintenance and defect remediation. The impacts of an Automated Condition Assessment system on FM efficiency, risk reduction, maintenance cost reduction, and required manpower are demonstrated in practice across four offshore deepwater production facilities.
Methods, Procedures, Process
Inspection Data is collected across the entirety of the facilities using a terrestrial scanner. Corrosion onset, coating degradation, and equipment is detected, classified, and identified across the facility using the Automated Condition Assessment System, empowered by machine learning and computer vision algorithms. Equipment is tagged with unique piping line numbers per design, fixed equipment tags, or a unique asset identification number. Detected defects and equipment tags are registered together, which results in a comprehensive equipment condition database which is used to better prioritize asset management and maintenance processes.
Results, Observations, Conclusions
Recommendations and their impacts from the Automated Condition Assessment System are compared against recommendations and impacts from the standard GVI process (i.e., physical walkdowns) conducted one year earlier. Reported results are averaged across the four deepwater production facilities. The Automated Condition Assessment System achieved increased inspection coverage, at a reduced cost, with decreased PoB (Person on Board) requirements. Facility inspection coverage rose from 15% to >95%, with a 6% of the usual PoB requirement, and at a 50% inspection cost reduction. Workpacks are created based on the Automated Condition Assessment System recommendations. Better prioritization of maintenance resulted in an estimated 86% reduction in maintenance costs, over a two year period.
Novel/Additive Information
The Automated Condition Assessment system contributes directly to greater risk awareness, targeted remediation strategies, improving the overall efficiency of the asset management process, reducing maintenance costs, and the downtime of offshore facilities.
Introduction
Method
Spherical imagery (i.e., 360° panoramic images) and laser scans are captured across deepwater oil and gas production facilities. Survey points are placed approximately every 1.5 m across the entirety of the platform. Here, a Leica RTC360 data capture device is used, however the automatic detection of coating condition is agnostic to other similar data capture devices. Due to the spacing of survey points, equipment often appears in multiple views, i.e., it is common for the inspection data to capture equipment from many different angles and ranges. Tt is possible to combine the multiple inspection viewpoints together, ensuring comprehensive coverage of the inspection site and comprehensive equipment coverage. The data capture process aims to cover 100% of the platform surface. Physical complexities such as tight areas or concealed equipment make some sections difficult to survey and ‘at-heights’ scans are captured to maximize the inspection coverage. An example of a captured spherical image is seen in Figure 1 a). Figure 1 b) shows the range information captured by the laser scan, and Figure 1 c) shows a 3D point-cloud representation, made by combining a number of captured scans.


Figure 1 a) shows a single captured spherical image; b) shows the accompanying laser-scan with light shades being closer in range and dark shades being further in range; and c) shows a 3D point-cloud representation, made by combining a number of scans.
Equipment Condition Processing


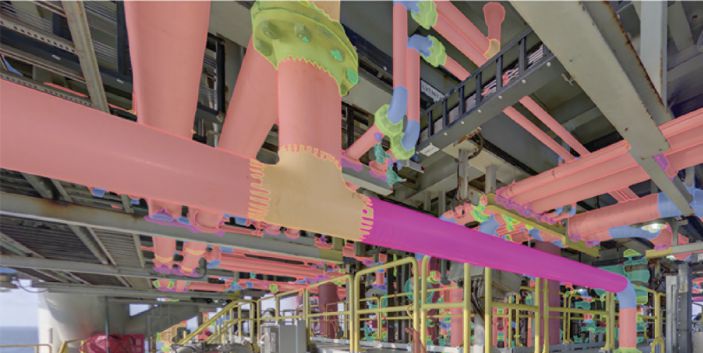
Corrosion onset and severity classification is detected and classified across the facility using machine learning and computer vision algorithms [1], see Figure 3. Pressure equipment is also identified, see Figure 4. The coating condition of each piece of equipment is subsequently assessed [2], see Figure 5. The physical area, dimensions, and location of detected corrosion instances and coating condition is determined.

Equipment is tagged with a unique asset identification number, fixed equipment tags, or unique piping line numbers per design. The detected defects (i.e., corrosion damage and the coating condition assessment) and equipment tags are registered together, which results in a comprehensive equipment condition database. All detected corrosion and coating condition assessments are associated with individual pieces of equipment and can be searched, filtered, and sorted for in the anomaly register, see Figure 6. Each row of the list view contains interactive links to the image view, corresponding image links to all camera angles in which the subject is captured, and metrics associated with the equipment. Entering the image interface brings the user into the virtual replication of the facility capable of being navigated in a ‘walk-through’ mode, allowing assessment of subject equipment from various camera angles. Individual equipment information can be queried and filtered (for instance, by pipe diameter, pressure, service designation, etc.). For example, the user can query all lines of the ‘high pressure gas’ service type with ‘Ri 5’ coating condition. These can be then scheduled for priority remediation. The Automated Condition Assessment System additionally provides the ability to break down a facility by regions or blocks, and quantify the coating condition in each block. A complete view of a facility’s asset integrity health allows for optimized maintenance, inspection, engineering, construction, and FM planning.
Information from the Automated Condition Assessment System can feed into Risk-Based Inspection (RBI) programs. Risk matrices and evaluations for each production asset are computed by comparing the the criticality of the equipment against the severity of corrosion and coating degradation. For example, a high pressure gas line may have a high consequence of equipment failure, have severe corrosion detected, and should therefore have a high follow-up inspection or remediation priority. This contextualization of equipment in the condition database is directly used to better prioritize asset management and maintenance processes.
Results
The system is deployed across four (two large and two medium-sized) deepwater offshore oil and gas platforms in the Gulf of Mexico (GoM). Recommendations from the Automated Condition Assessment System are compared against the standard physical surveys (manual GVIs) which were conducted one year earlier. Impacts to both inspection and maintenance campaigns are detailed. Results are averaged across four offshore oil and gas platforms. The results and impacts of both the physical surveys (i.e., walk downs) and the Automation Condition Assessment System are compared through the lens of Inspection Campaigns and Paint Block Surveys.
Inspection Campaigns

Inspection Campaigns
Collection of inspection imagery for a large deep-water spar facility requires approximately twelve days with eight data-scanning personnel. Approximately 75% of all equipment is covered by deck-level scans. Coverage is further improved to approximately 22% through the capture of scans in positions that consider corner cases such as tight spaces, complex pipework and equipment at heights. In contrast, only 15% of lines were covered in the 2019 physical GVI campaign, see Table 1. The Automated Condition Assessment System, therefore, provided far greater inspection coverage. This was achieved by significantly reducing the PoB requirement for a successful inspection, with the Automated Condition Assessment requiring only 6% of the physical GVI PoB. Further, the full platform health assessment provided by the Automated Condition Assessment System was 50% less than the proposed annual budget for traditional manned general visual inspection (GVI). The direct, recurring savings for each following year would continue annually for this platform. Further, the scope of each AI-based inspection includes >95% of equipment, compared with about 15% coverage of the 2019 GVI campaign, significantly reducing facility-wide asset-integrity risk. About 50% of target inspection PoB is achieved through the more efficient targeting of high-severity corrosion on equipment.
Paint Block Surveys


CAT3 paint remediation is the cheapest remediation to undertake; CAT2 replacement remediation typically involves a planned shutdown and costs in the range of 10 to 20 times more than CAT3 remediation; CAT1 replacement remediation typically involves an unplanned shutdown and costs in the range of 20 to 25 times more than CAT3 remediation. Preventing CAT-level change and maintaining equipment to avoid replacement is a critical tool for reducing maintenance backlog/cost. Figure 7 highlights the importance of painting recommendations in order to avoid replacement. Maintaining equipment with paint remediation to avoid replacement is a critical tool for reducing maintenance backlog and maintenance costs. Table 2 details the improved paint block surveys directly resulting in more impactful paint remediation actions, for a single platform. Across the four platforms, 620 CAT3 status lines were nominated for paint remediation before they could transition to CAT2 status which would require planned shutdown replacement. These lines were not scheduled to be inspected in the next two years and were estimated to require replacement within those two years if no remediation action was taken. Catching these lines for paint remediation reduced maintenance costs by approximately ten times, over the two-year period. Further, 160 CAT2 status lines were nominated for replacement via planned shutdown. These lines were not scheduled for inspection within the next year and had an estimated time of failure within six to twelve months. The 160 lines nominated were associated with 20 to 25 major circuits, per platform, and avoided the high cost of failure and unplanned shutdown for the platform operator. All nominated lines were targeted by maintenance crews for high-priority remediation by the platform operators. The detection of coating degradation and subsequent prioritization of painting schedules by the Automated Condition Assessment System represents a significant reduction in financial risk and maintenance costs for facility operators.
Conclusion
An Automated Condition Assessment System is deployed across four deepwater oil and gas production facilities located in the GoM. The following case study demonstrates the value of an Automated Condition Assessment System. A comparison between a traditional manned general visual inspection (GVI) campaign is compared directly against the Automated Condition Assessment System. The case study demonstrates: the cost reduction of inspection programs versus traditional manned visual inspections; the reduction of required inspection PoB; the reduction in required inspection budget; the benefits associated with prioritization and optimization of painting campaigns; and reduction in FM costs. Catching equipment degradation before it could degrade to the level of needing replacement is a critical tool to reducing maintenance backlog/cost.
Manual inspection of offshore platform topside equipment is costly, time-consuming, and labor-intensive. Moreover, inspection findings are subjective and provide incomplete asset coverage, leading to increased risk of unplanned shutdowns due to missed repairs. The Automated Condition Assessment system contributes directly to greater risk awareness, targeted remediation strategies, improving the overall efficiency of the asset management process and reducing the down-time of offshore facilities.
Bibliography
[1] Majors, M., Harrington, T., Ferguson, E., Dunne, T., Potiris, S., Vlaskine, V., Mohammed, J., Bargoti, S., Naqshbandi, M. and Ahsan, N., 2020, November. Automated Corrosion Mapping AI & Machine Learning. In Abu Dhabi International Petroleum Exhibition & Conference. OnePetro.
[2] Ferguson, E., Dunne, T., Windrim, L., Bargoti, S., Ahsan, N. and Altamimi, W., 2021, December. Automated Painting Survey, Degree of Rusting Classification, and Mapping with Machine Learning. In Abu Dhabi International Petroleum Exhibition & Conference. OnePetro.
