Stereo Image System for Inspection of Mooring Chain in the Splash Zone
Abstract
This article outlines an optical stereo photogrammetric imaging system, called the Lantern Eye™ Air (LEA), for inspecting the mooring chain above the water in the area known as the splash zone. The system is mounted and deployed by a Rope Access Technician (RAT), and achieves data collection in this difficult to access region for subsequent 3D reconstruction and measurements for inspection.
Typically, splash zone mooring chain inspections are carried out using mechanical calipers which are difficult to deploy, provide measurements at discrete locations only and are dependent on the proficiency and judgement of the operator on the field. The LEA system overcomes these problems, providing objective, accurate and repeatable measurements based on reconstructed photorealistic 3D models. Imagery of the chain links is captured systematically which was used to generate 3D reconstructions and establish measurements of bar diameter and inter-grip length.
A splash zone inspection was undertaken on an offshore platform. The 3D metrology bar diameter measurements were within 1.7% of caliper measurements based on 2σ (95% confidence). Similarly, the 3D metrology inter-grip length measurements were within 0.9% of caliper measurements based on 2σ (95% confidence). Application of a systematic validation procedure following the inspection placed the expected uncertainty of measurements at the 1% range. Similarly, the uncertainty in caliper measurements has been estimated to be 2% based on the use of a standard handheld caliper and measurement procedure laid out in the ABS Guide for the Certification of Offshore Mooring Chain and the 2020 Life Extension Mooring Platform Chain Inspection. Considering these uncertainty bounds, the 3D metrology measurements can also be deemed consistent with the ground truth dimensions.
Based on the results, the LEA and 3D metrology measurements are consistent with current techniques and provide a more systematic and repeatable basis for mooring chain inspection and measurement in the splash zone. This is anticipated to improve the consistency and comparability of inspections and will enable precise change tracking between inspections.
Introduction
The authors undertook an inspection that demonstrated the technology for high-fidelity imaging and accurate contactless measurement of mooring chains within the splash zone. The authors have developed an optical stereo photogrammetric imaging system that can be deployed by a rope access technician (RAT) team. The system delivers photo-realistic 3D reconstructions and sub-mm accurate measurements. The system provides objective, accurate and repeatable measurements based on reconstructed photorealistic 3D models.
1.1 Background
The authors demonstrate its system on the inspected asset. The objective of the inspection was to validate the performance of the system against a traditional inspection using calipers. Typically, splash zone mooring chain inspections are carried out using mechanical calipers which are difficult to deploy and result in inconsistent measurements (due to variability in the placement and use of calipers). The system overcomes these problems, providing:
- Highly accurate measurements (achieving less than 1% error after post processing).
- Objective and repeatable measurements based on reconstructed photorealistic 3D models.
- Improved change tracking between inspections enabled by the comparison of 3D models.
1.2 Experimental scope
Five chain links within the splash zone were inspected on mooring lines 1, 2, 4 and 5. This interim report presents the results of the inspection and analysis for chain link A on mooring line 2. The report provides an overview of the data collection and post processing with measurements of bar diameter and inter-grip length. These are presented alongside caliper measurements captured following inspection with the system.
Methodology
Inspection Overview
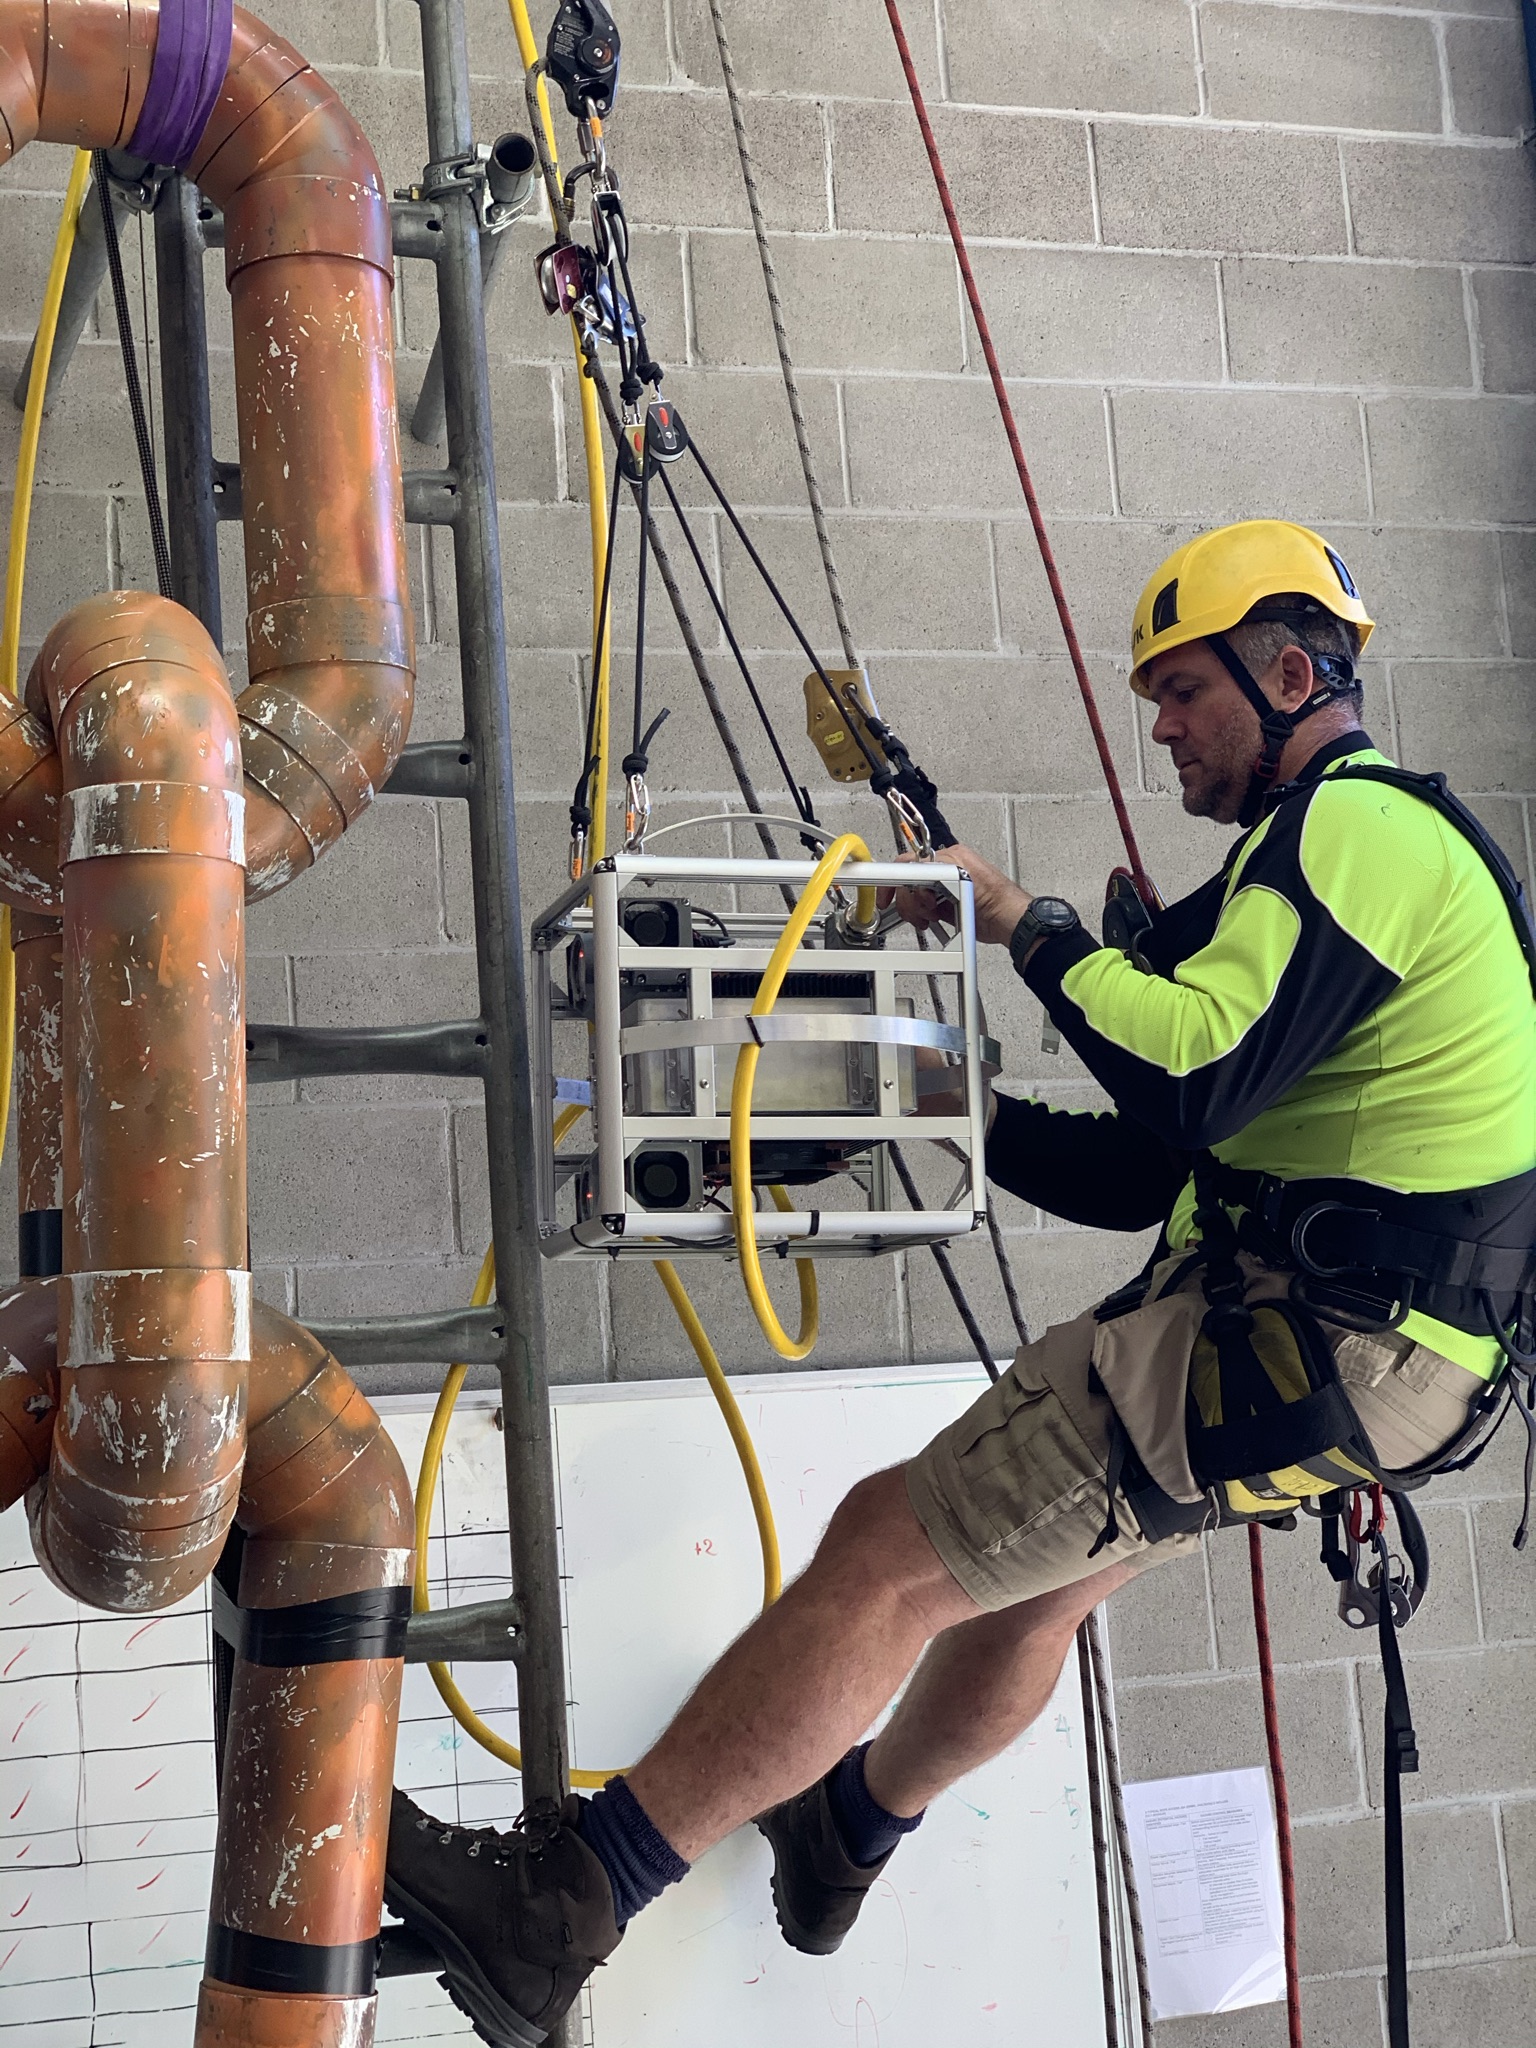
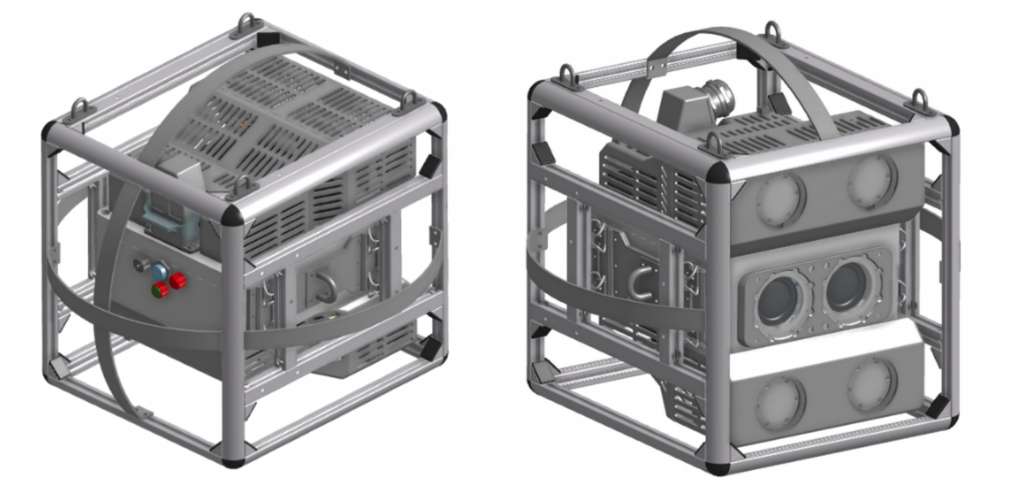
The system was developed using technology established by the authors for high-fidelity imaging and accurate contactless measurements of mooring chains underwater. The system was adapted to be handheld and deployable by a RAT team during routine splash zone inspections. The system is tethered and connected to a topside computer on the spar deck. The handheld sensor is composed of a high-resolution computer vision stereo camera coupled with four high-powered strobe lights.
Prior to the inspection, the system was precisely calibrated and tested to ensure the accuracy of measurements obtained. The system was also rigorously tested to perform within the harsh offshore environment and meet the demands of splash zone inspections. Field testing was used to design data collection procedures that were compatible with RAT team operations and which delivered consistent high-quality data.
Deployment of the system on the inspected asset involved the RAT personnel navigating around each chain in 360-degree orbits with the system. The imagery was captured continuously throughout the process. Live imagery was beamed to the topside computer with a technician verifying the quality of data and providing instructions for maintaining this data quality. Multiple orbits were conducted along the chain to capture imagery of each link at various angles.
3D Model Reconstruction and Measurement
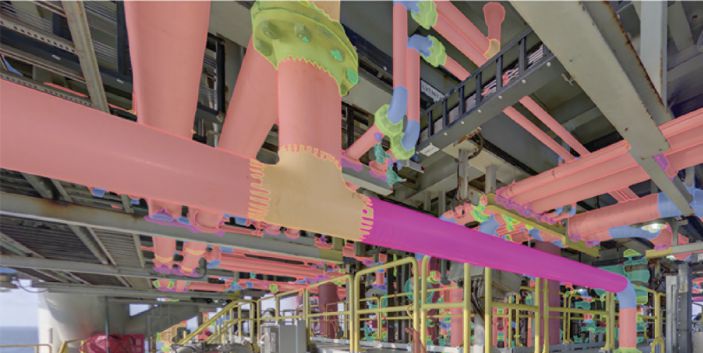
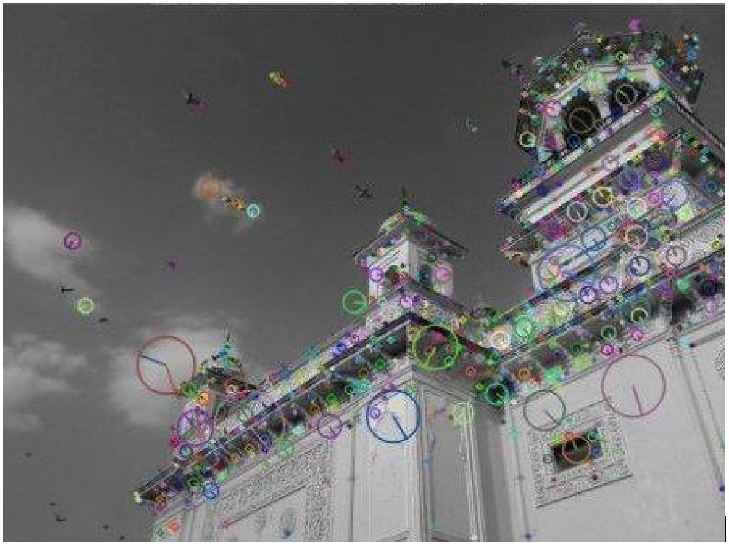
3D models were generated from the stereo image pairs collected. The method applied relies on SIFT (Scale Invariant Feature Transform), see Figure 3. These encode basic form and color. Onsite calibration was also undertaken of the system to improve reconstruction.
The conversion of the images to a point cloud involved the following:
- Images had features extracted, and then associated across images, allowing relative placement of cameras (localization). The resulting localized features were “sparse” so that the point density is in the cm range.
- Image sets from localized cameras were then used for extracting points per desired image patch. The point density was significantly higher, up to the 0.1mm range depending on patch size.
- Local smoothing was undertaken by assuming the object has a locally smooth surface, further removing outliers and improving the accuracy of reconstruction estimates. The point density is decreased by a factor related to the desired smoothing.
- The point cloud was then meshed by interpolating adjacent points with triangular and quadrilateral polygons.
Measurements were then extracted from the models produced in accordance with typical inspection requirements for mooring chains, and locations corresponding to caliper measurements. The process involved:
- Aligning the models with regards to the principal axes of measurement (i.e., defining the vertical and horizontal axes parallel to which measurements will be taken).
- Sectioning the models at measurement locations as appropriate.
- Applying simulated calipers along the measurement axes (composed of planes fit to the outermost point of the model along the measurement axes).
Results
This section provides the results of the inspection and analysis of mooring lines 1, 2, 4 and 5. Measurements for chain links A to E on each of the four mooring lines are presented herein.
Dimensional Control Summary
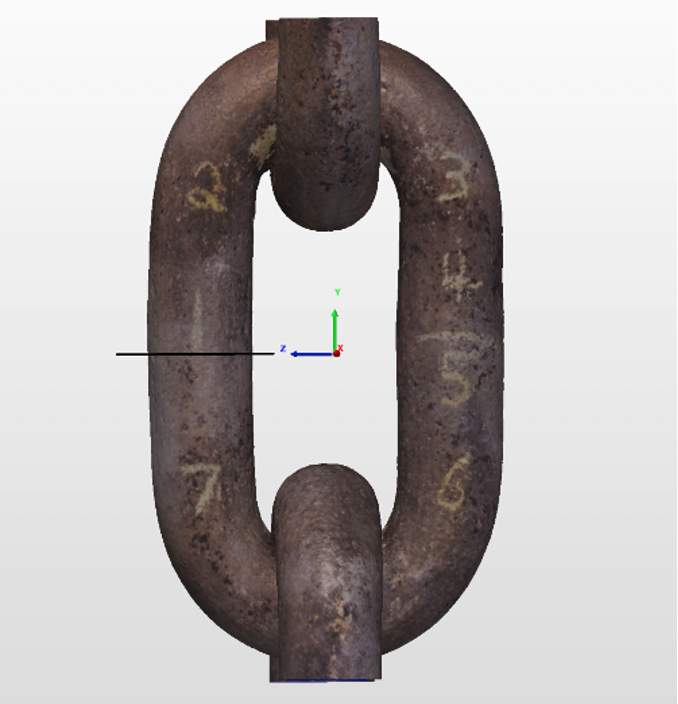
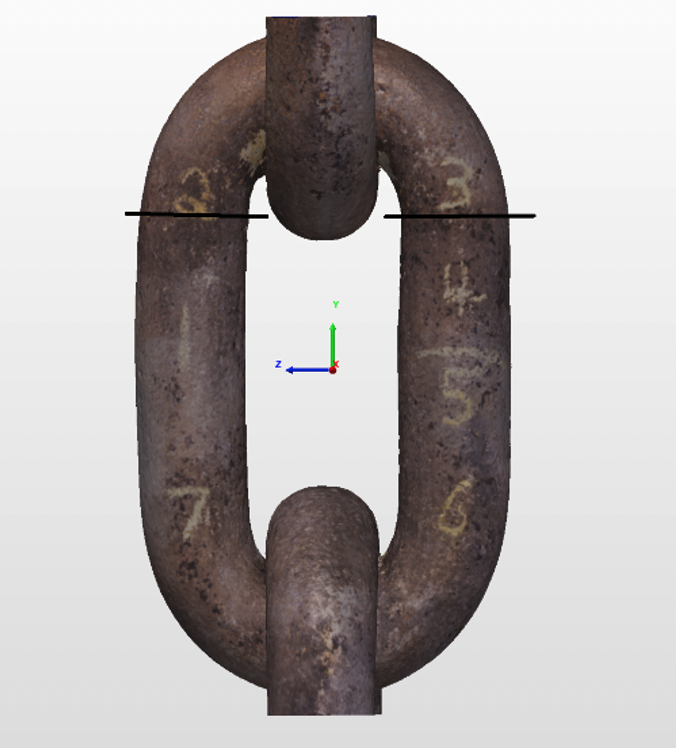
The locations on the chain links at which caliper and 3D metrology measurements have been taken are shown in Figure 4 to Figure 8. The measurement locations are based on typical inspection requirements. The measurement locations include:
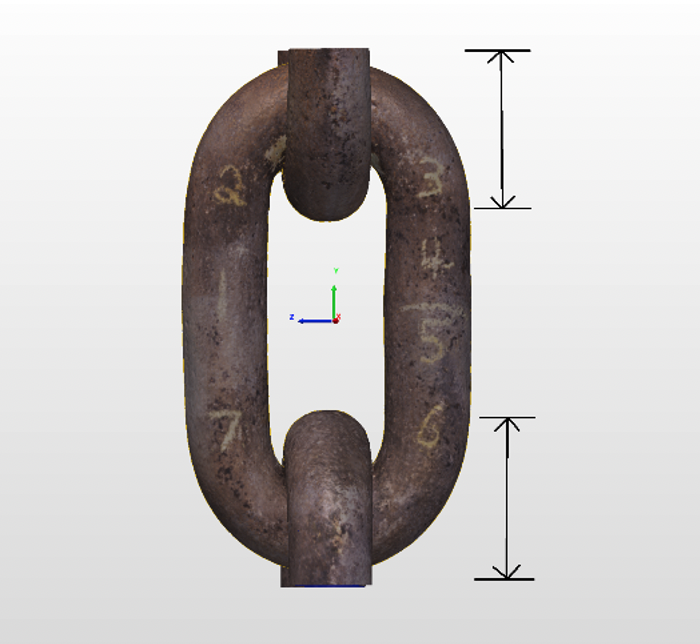
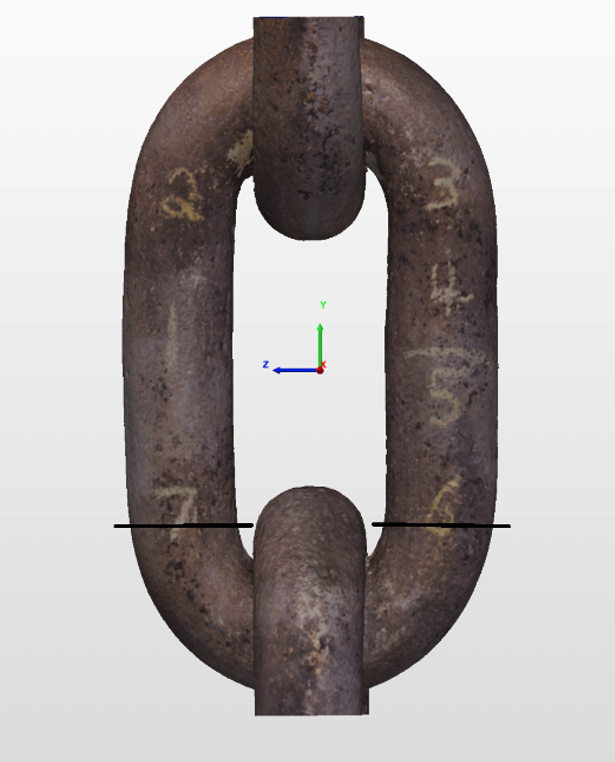
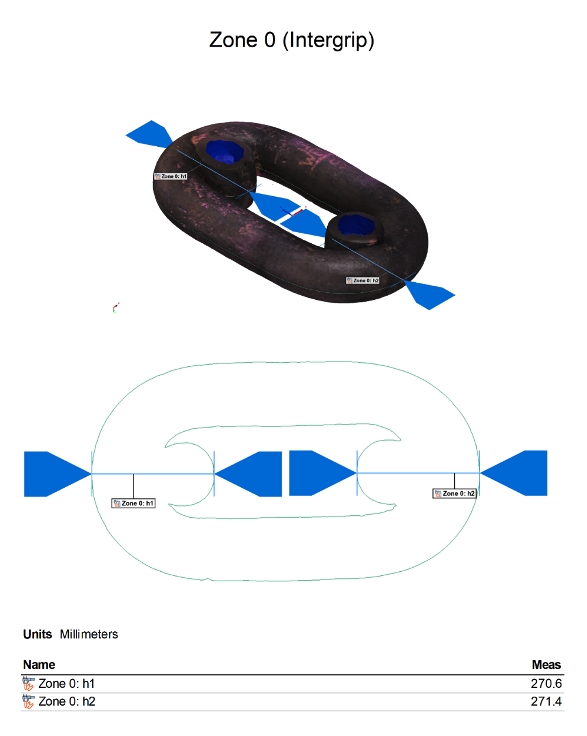
- Inter-grip length (Zone 0): which includes two in-plane measurements at 0° relative to the vertical axis as shown in Figure 4.
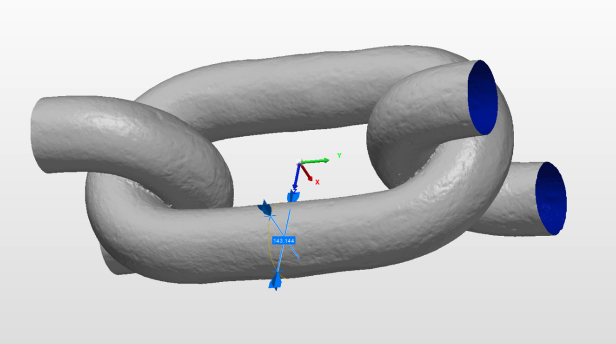
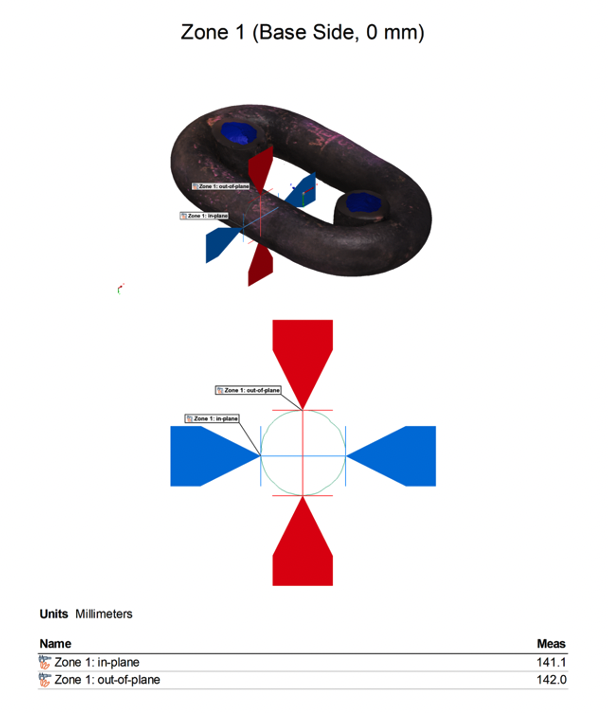
- Base section (Zone 1): that includes in-plane and out-of-plane measurements at the base side straight section at 0mm from the centerline of the chain as shown in Figure 5.
- Above mid-section (Zone 2): which includes in-plane and out-of-plane measurements at the base side straight section at 200mm above the centerline of the chain as shown on the left side of the chain in Figure 6.
- Above mid-section (Zone 3): which includes in-plane and out-of-plane measurements at the weld side straight section at 200mm above the centerline of the chain as shown on the right side of the chain in Figure 6.
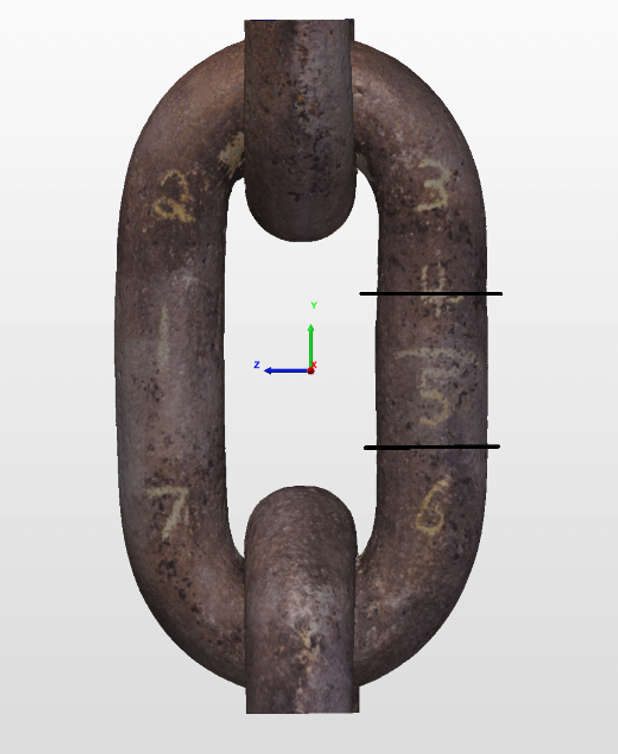
- Weld side (Zone 4): which includes in-plane and out-of-plane measurements at the weld side straight section at 100mm above the centerline of the chain as shown in Figure 7.
- Weld side (Zone 5): which includes in-plane and out-of-plane measurements at the weld side straight section at 100mm below the centerline of the chain as shown in Figure 7.
- Below mid-section (Zone 6): which includes in-plane and out-of-plane measurements at the base side straight section at 200mm below the centerline of the chain as shown on the left side of the chain in Figure 8Figure 6.
- Below mid-section (Zone 7): which includes in-plane and out-of-plane measurements at the weld side straight section at 200mm below the centerline of the chain as shown on the right side of the chain in Figure 8.
For each of the preceding measurement locations (Zones 1-7), in-plane and out-of-plane measurements were taken along the measurement axes accurately aligned with the plane of the chain link. This is shown in Figure 9.
Measurement Uncertainty
Application of a systematic validation procedure placed the expected uncertainty of measurements at the 1% range for metrology measurements. This considers a 95% confidence bound and the underwater use of the system, a more challenging environment than in air. This represents an upper bound estimation of uncertainty with the system.
To calculate the caliper uncertainty measurement several sources of error were considered. These include:
- Intrinsic error of up to 0.1mm for a typical field caliper.
- Variation in the angle of the measurement of up to 5o relative to the plane of measurement. Based on geometry this contributes to an error of up to 0.4% of the measurement being taken.
- Variation in the angle of the measurement of up to 5o along the plane of measurement. Experimentation on the chain link models showed that shifting the measurement by this angle resulted in a maximum variation of 1% of the bar diameter and inter-grip length.
- Variation of the position along the chain link at which a measurement is taken of up to 5mm.Experimentation on the chain link models showed that shifting the measurement up and down or left and right by this distance resulted in a maximum variation of 1% of the bar diameter and inter-grip length.
Considering these sources of error to be independent the cumulative error is estimated to be in the order of 2%. Without a precise definition of the caliper measurement procedure this estimate is only intended to be for reference.
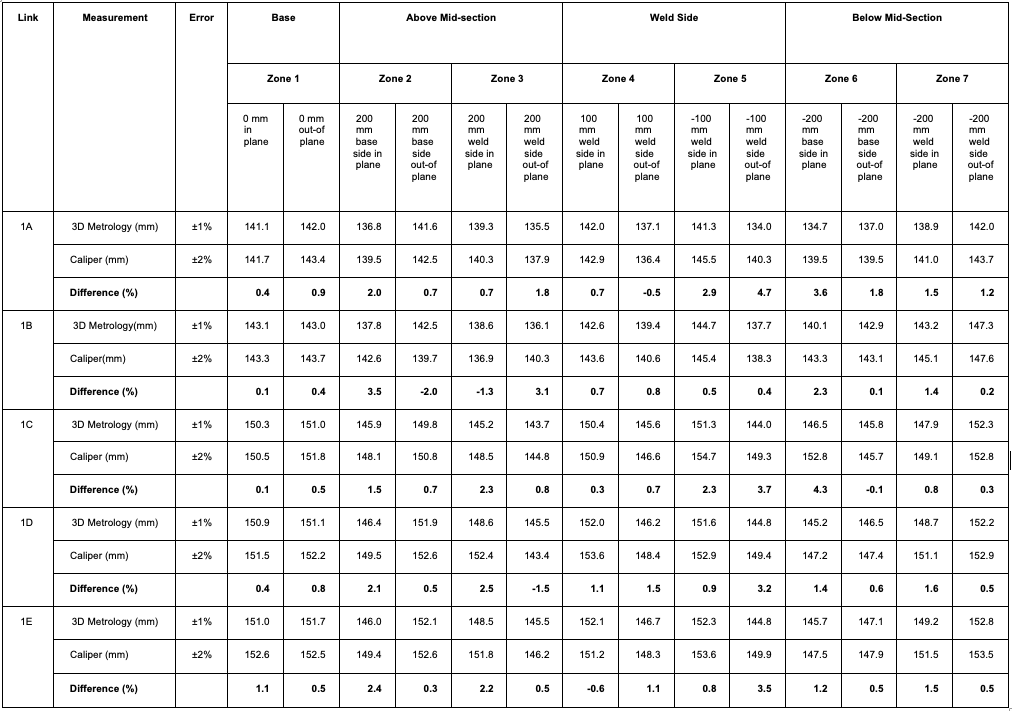
Caliper and 3D Metrology Bar Diameter Measurements
Measurements of the bar diameter of each chain link were extracted from the models by first aligning them with the principal axes of measurement, sectioning the models at measurement locations and applying simulated calipers along the measurement axes to obtain the distance between the most extreme points on the section. An example diameter measurement is shown in Figure 10. The measurement results are presented alongside the corresponding caliper measurements in Appendix A for mooring line 1 as an example.
The 2σ (95% confidence) variation between the caliper and 3D metrology measurements is representative of the maximum deviation between measurement techniques for 95% of results.
| Bar diameter measurements | 2σ (95% confidence) variation between 3D metrology and caliper measurements |
| Mooring line 1 | 1.3% |
| Mooring line 2 | 1.1% |
| Mooring line 4 | 0.8% |
| Mooring line 5 | 1.8% |
| Cumulative mooring line 1, 2, 4, 5 | 1.7% |
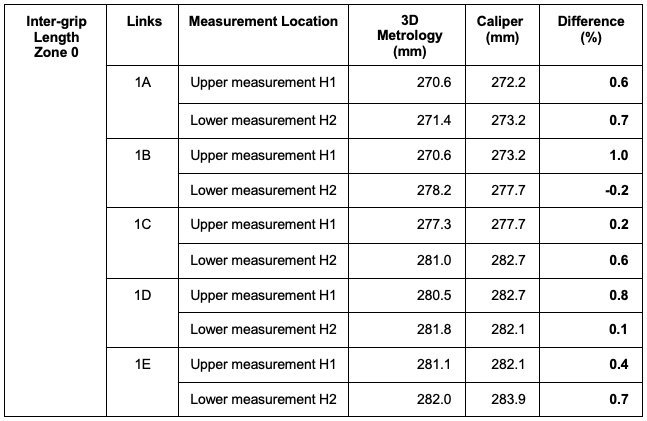
Caliper and 3D Metrology Inter-grip Length Measurements
Measurements of the inter-grip length between each chain link were extracted from the models by first aligning them with the principal axes of measurement, sectioning the models at measurement locations and applying simulated calipers along the measurement axes to obtain the distance between the most extreme point on adjacent links. An example inter-grip measurement is shown in Figure 11. The measurement results are presented alongside the corresponding caliper measurements in Appendix B for mooring line 1 as an example.
The 2σ (95% confidence) variation between the caliper and 3D metrology measurements is representative of the maximum deviation between measurement techniques for 95% of results.
| Inter-grip length measurements | 2σ (95% confidence) variation between 3D metrology and caliper measurements |
| Mooring line 1 | 0.4% |
| Mooring line 2 | 0.9% |
| Mooring line 4 | 1.4% |
| Mooring line 5 | 0.6% |
| Cumulative mooring line 1, 2, 4, 5 | 0.9% |
Conclusion
The authors successfully deployed its system to inspect splash zone links that were pulled in to be accessible in air of mooring lines 1, 2, 4 and 5 on the inspected asset. The system was deployed by a RAT team. Imagery of the chain links was captured systematically which was the used to generate 3D reconstructions and establish measurements of bar diameter and inter-grip length.
This report has presented the results of the inspection and analysis for chain links A to E on mooring lines 1, 2, 4 and 5. Measurements of bar diameter and inter-grip length determined from 3D metrology analysis were presented alongside caliper measurements captured onsite.
The 3D metrology bar diameter measurements were within 1.7% of caliper measurements based on 2σ (95% confidence). Similarly, the difference in 3D metrology inter-grip length measurements was within 0.9% of caliper measurements based on 2σ (95% confidence). The application of a systematic validation procedure following the inspection placed the expected uncertainty of measurements at the 1% range. Similarly, the uncertainty in caliper measurements has been estimated to be 2% based on the use of a standard handheld caliper and measurement procedure laid out in the ABS Guide for the Certification of Offshore Mooring Chain and the 2020 Life Extension Mooring Platform Chain Inspection. Considering these uncertainty bounds, the 3D metrology measurements can also be deemed consistent with the ground truth dimensions.
Based on the results, the system and 3D metrology measurements are relatively consistent with current techniques and provide a more systematic and repeatable basis for mooring chain inspection and measurement in the splash zone. This is anticipated to improve the consistency and comparability of inspections and will enable precise change tracking between inspections.
Appendix A
Caliper and 3D metrology measurements of bar diameter for chain links on mooring line 1 (example of measurements used to construct results table)
Appendix B
Caliper and 3D Metrology measurement of inter-grip length for mooring line 1.
Authors: Lashika Medagoda, Thomas Van Bruggen, Mitchell Galea, Hamish Morgan, Tajamul Syed, Abraham Kazzaz, Fraser Hamersley, and Jordan Jolly